The Whitworth Meteorological Observatory - 2011 Archive Data
Daily Archive Plots
| January | February | March | April | May | June |
| July | August | September | October | November | December |
Summary Plots
Below are some plots showing summaries of some parameters for the whole year, and some comparisons with average data from the Met Office station at Ringway (North West England and Isle of Man Climate). All plots are clickable and link to full size versions.
Temperature
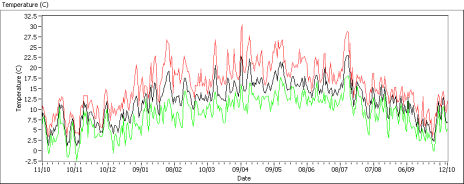
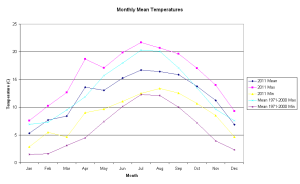
The monthy temperature plot shows that overall Manchester in 2011 was warmer than the longterm average. This may well be due to the urban location of the Whitworth Observatory. However the months of April, October and November had temperatures which were higher than would be expected from the trend in the average data, and no months were significantly colder.
Wind
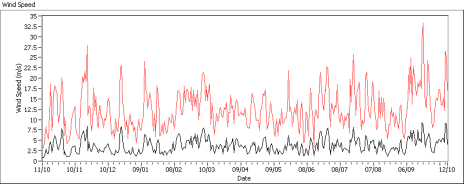
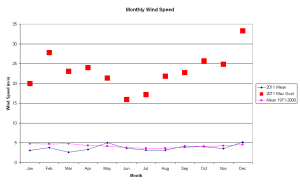
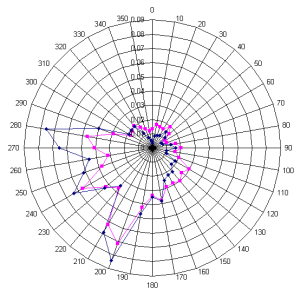
These plots show that the prevailing wind direction at the Whitworth Observatory is in the south west quadrant. For the earlier part of the year wind speed was below average, while later in the year monthly means were very close to the long term average. There were however some particularly windy days as illustrated by the maximum wind gusts.
Precipitation
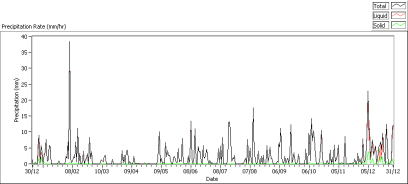
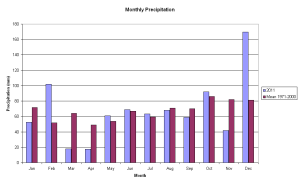
Total rainfall during 2011 as recorded by the Whitworth Observatory totalled 814mm which was very close to the long term average of 806mm. However there was significant month to month variation with March, April and November being significantly drier and February and December significantly wetter than the long term average.
Sunshine
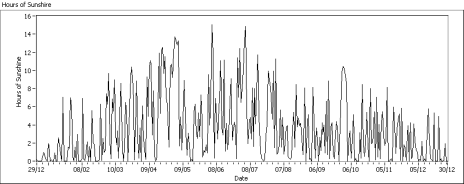
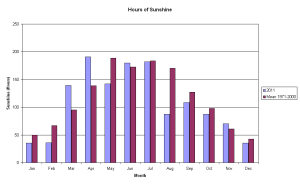
Overall sunshine hours recorded at the Whitworth Observatory were 100 hours lower than the long term average at Ringway, with some significant month to month variations. March and April were notably sunnier than usual, while August saw approximately half the average hours of sunshine for that month.
All data and images copyright The University of Manchester. Please do not reproduce without permission. Enquiries regarding use of data from the Whitworth Observatory should be directed to Dr Michael Flynn (michael.flynn@manchester.ac.uk).